
Largest Contentful Paint (LCP) is the amount of time it takes to load the single largest visible element in the viewport. It represents the website being visually loaded and is one of the three Core Web Vitals (CWV) metrics Google uses to measure page experience.
The first impression users have of your site is how fast it appears to be loaded.
The largest element is usually going to be a featured image or maybe the <h1> tag. But it could also be any of these:
- <img> element
- <image> element inside an <svg> element
- Image inside a <video> element
- Background image loaded with the url() function
- Blocks of text
<svg> and <video> may be added in the future.
Anything outside the viewport or any overflow is not considered when figuring out the size. If an image occupies the entire viewport, it’s not considered for LCP.
Let’s look at how fast your LCP should be and how to improve it.
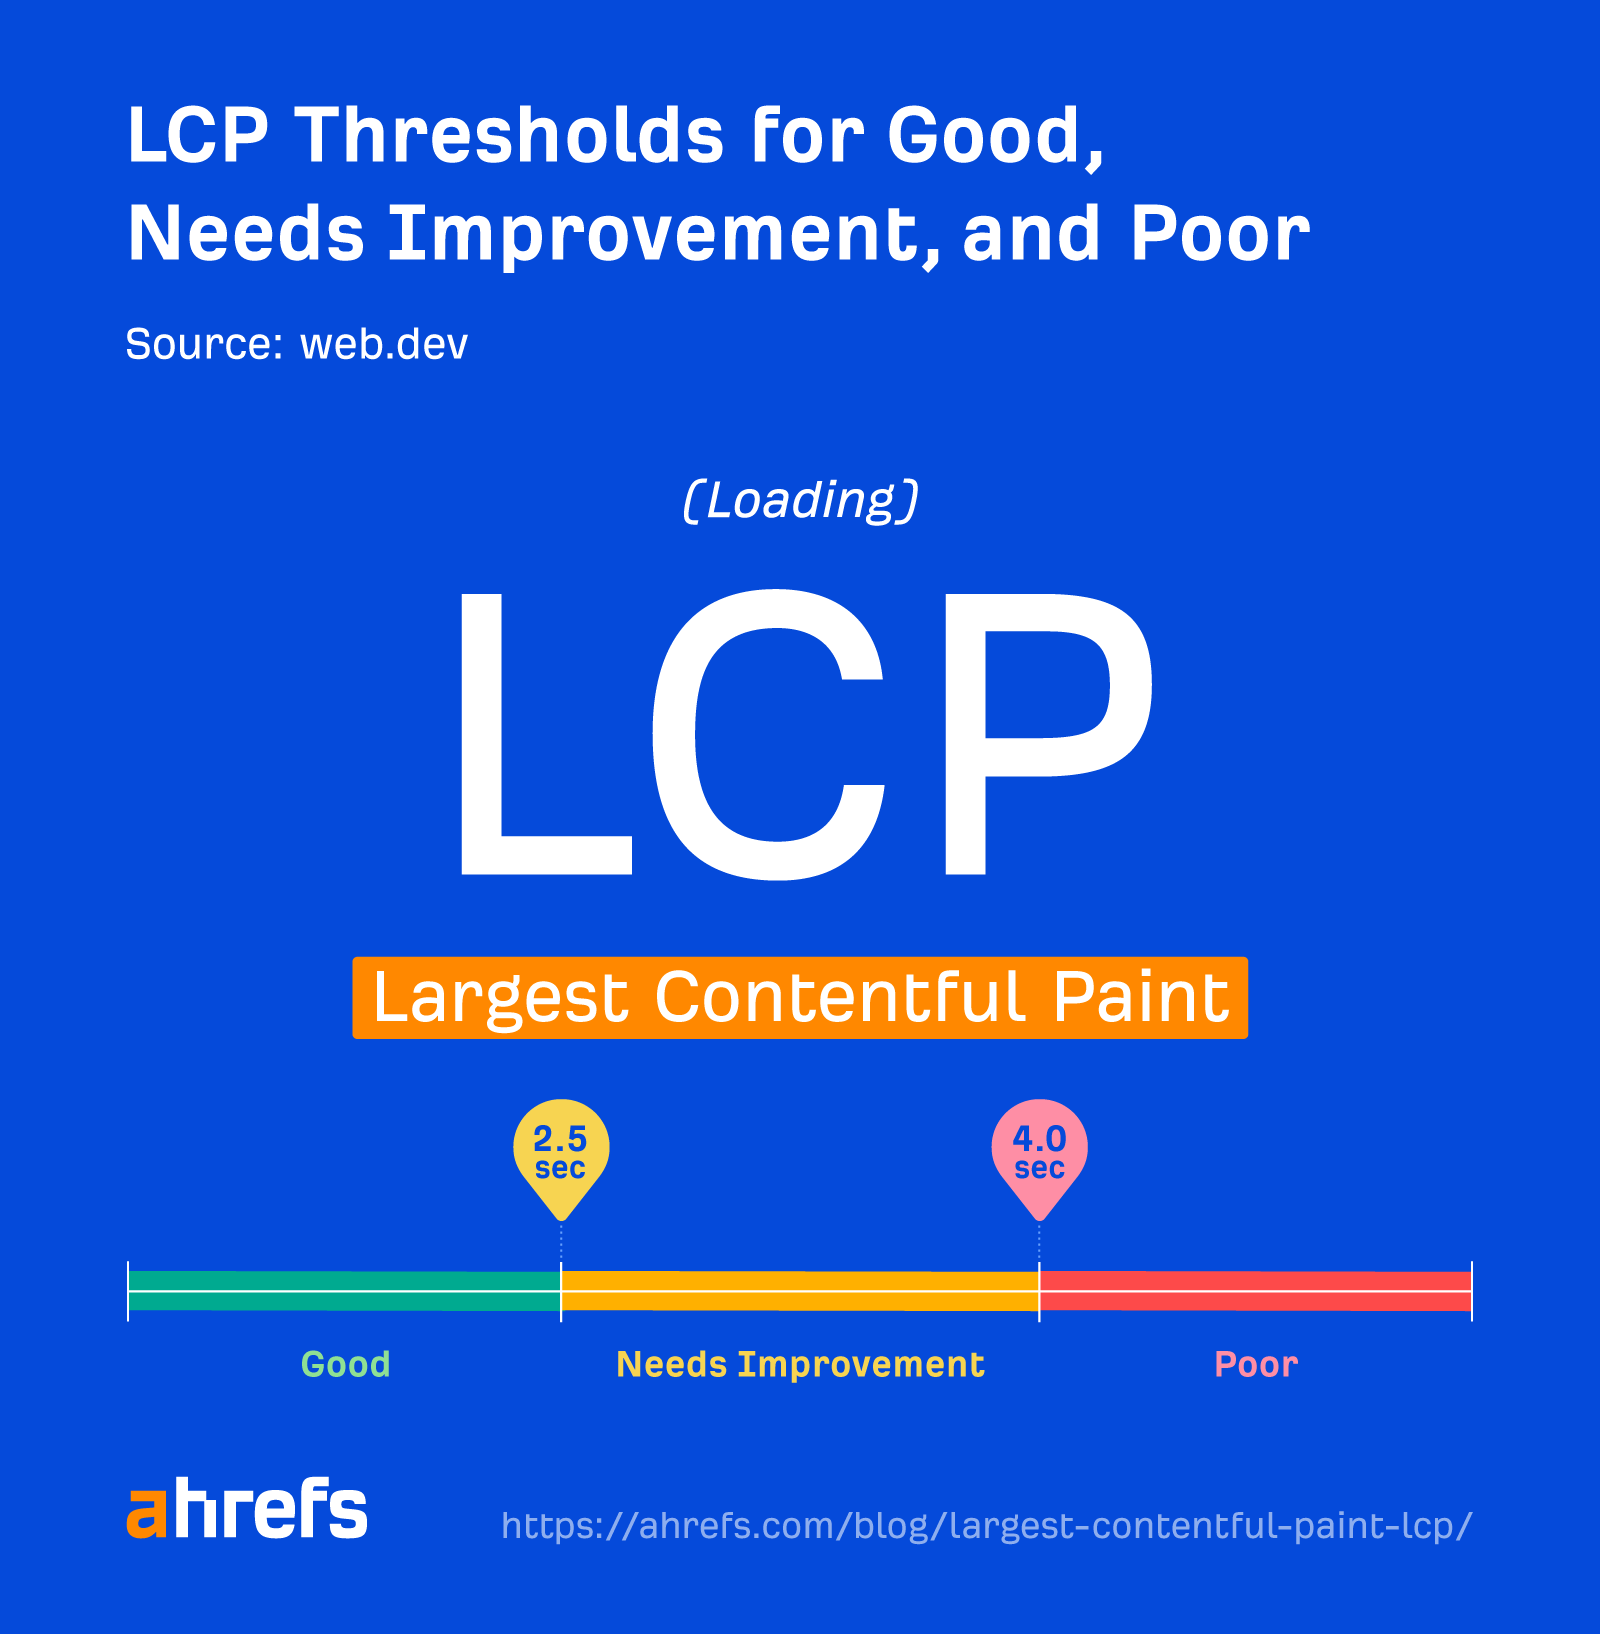
A good LCP value is less than 2.5 seconds and should be based on Chrome User Experience Report (CrUX) data. This is data from actual users of Chrome who are on your site and have opted in to sharing this information. You need 75% of page visits to load in 2.5 seconds or less.
Your page may be classified into one of the following buckets:
- Good: <=2.5s
- Needs improvement: >2.5s and <=4s
- Poor: >4s
LCP data
57.1% of sites are in the good LCP bucket as of April 2023. This is averaged across the site. As we mentioned, you need 75% of page visits to load in 2.5 seconds or less to show as “good” here.
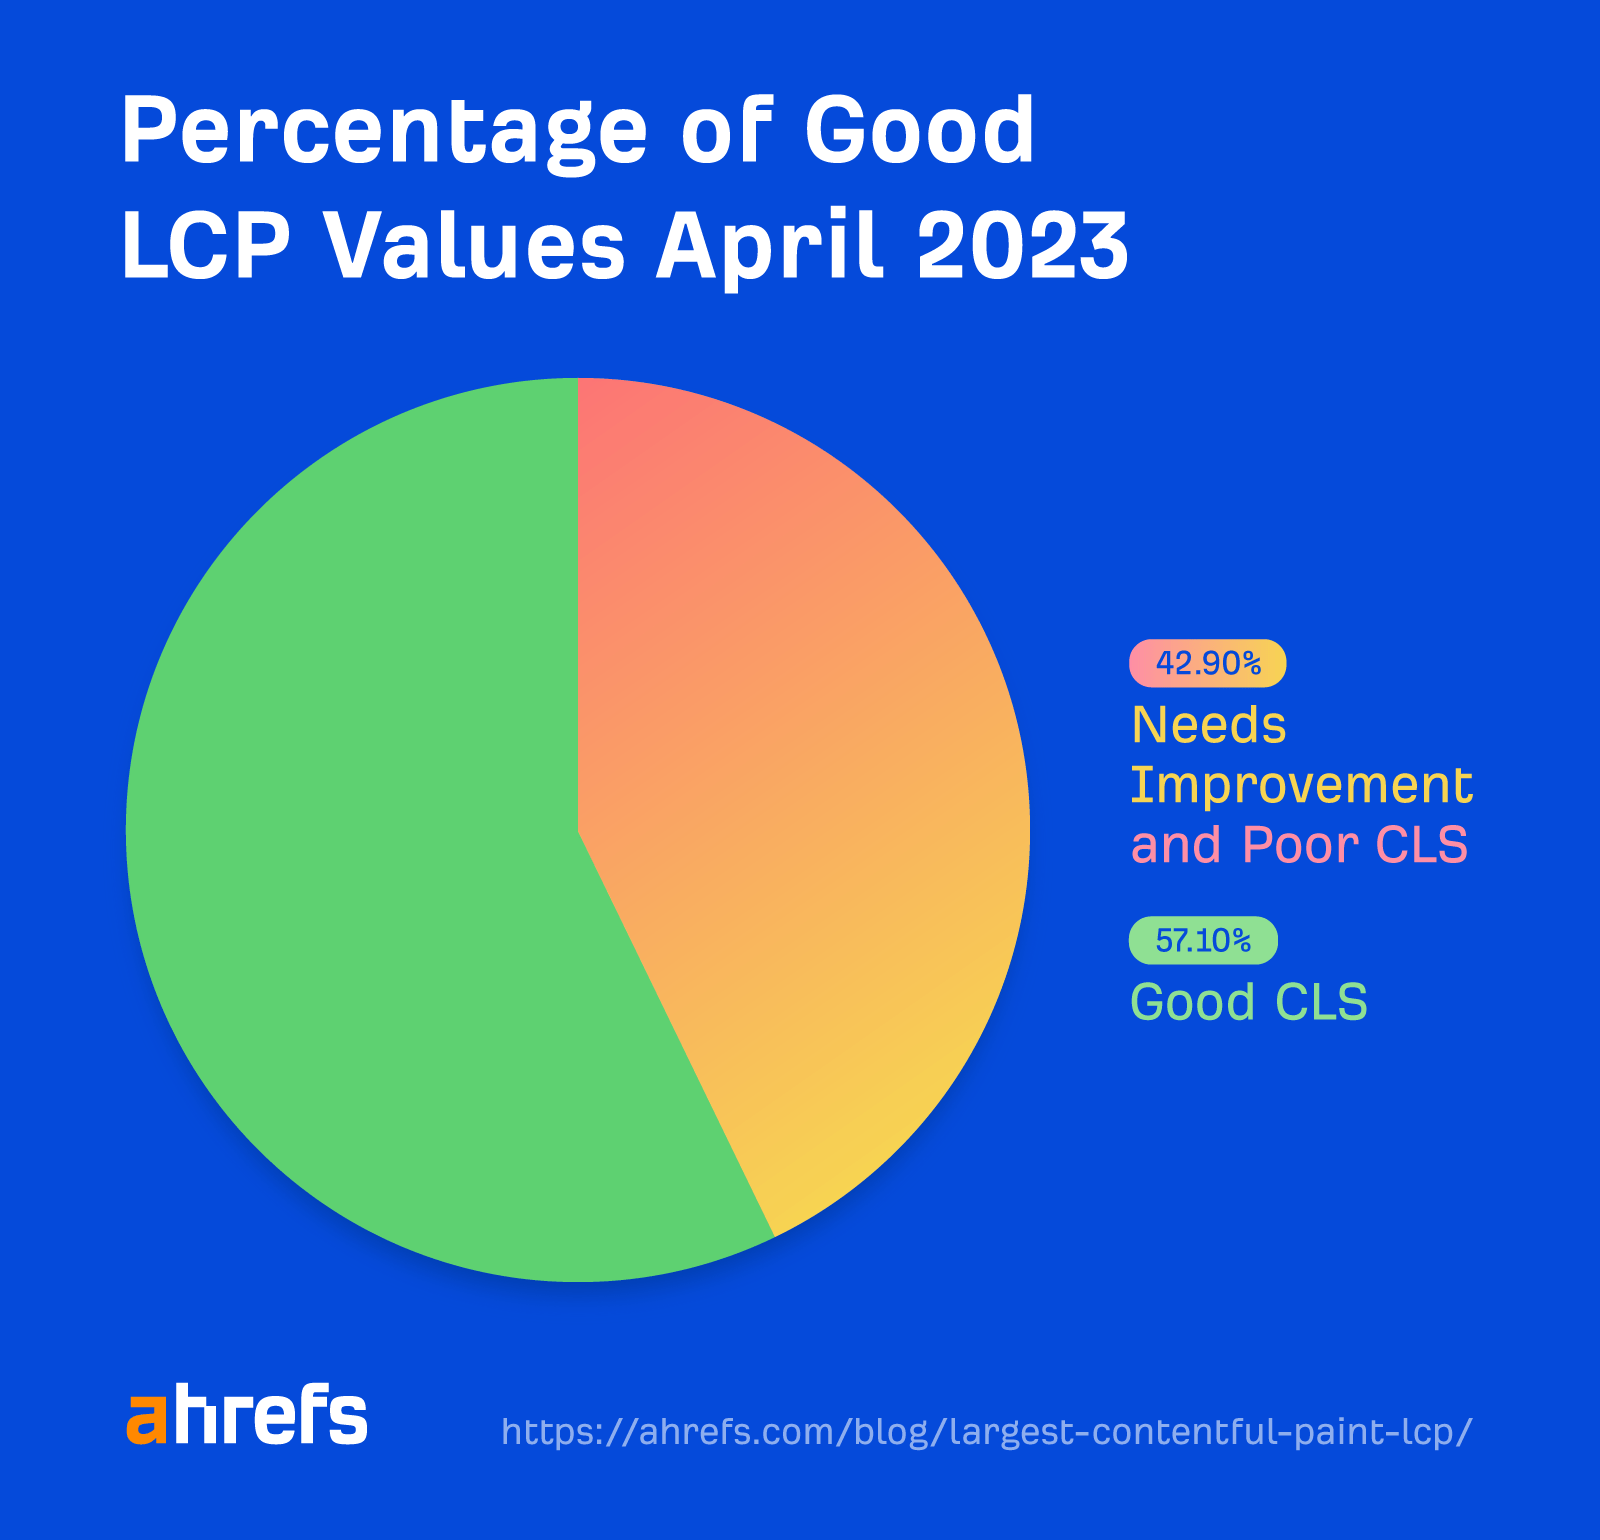
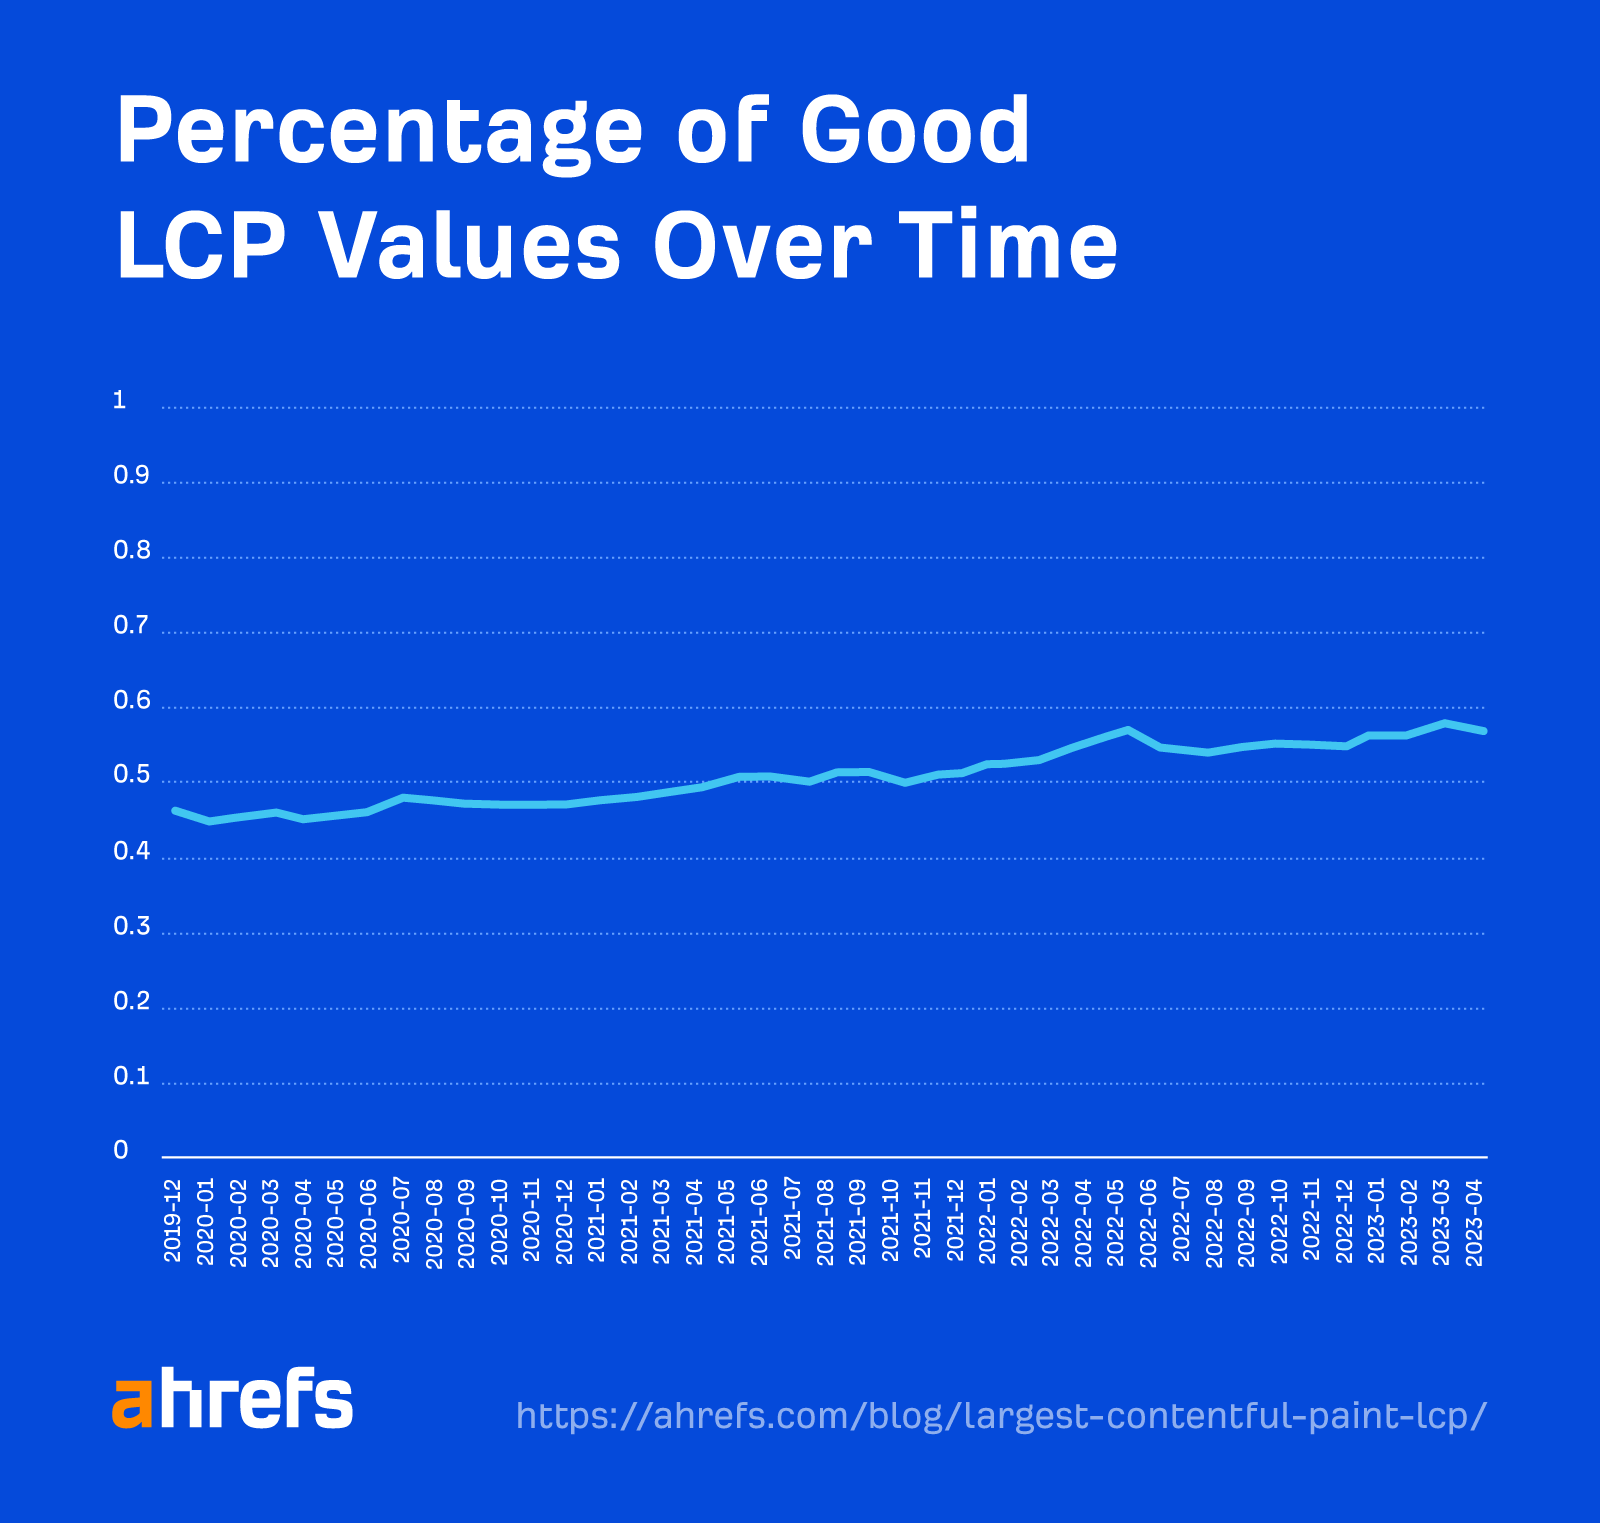
LCP is the Core Web Vital that people are struggling the most to improve.
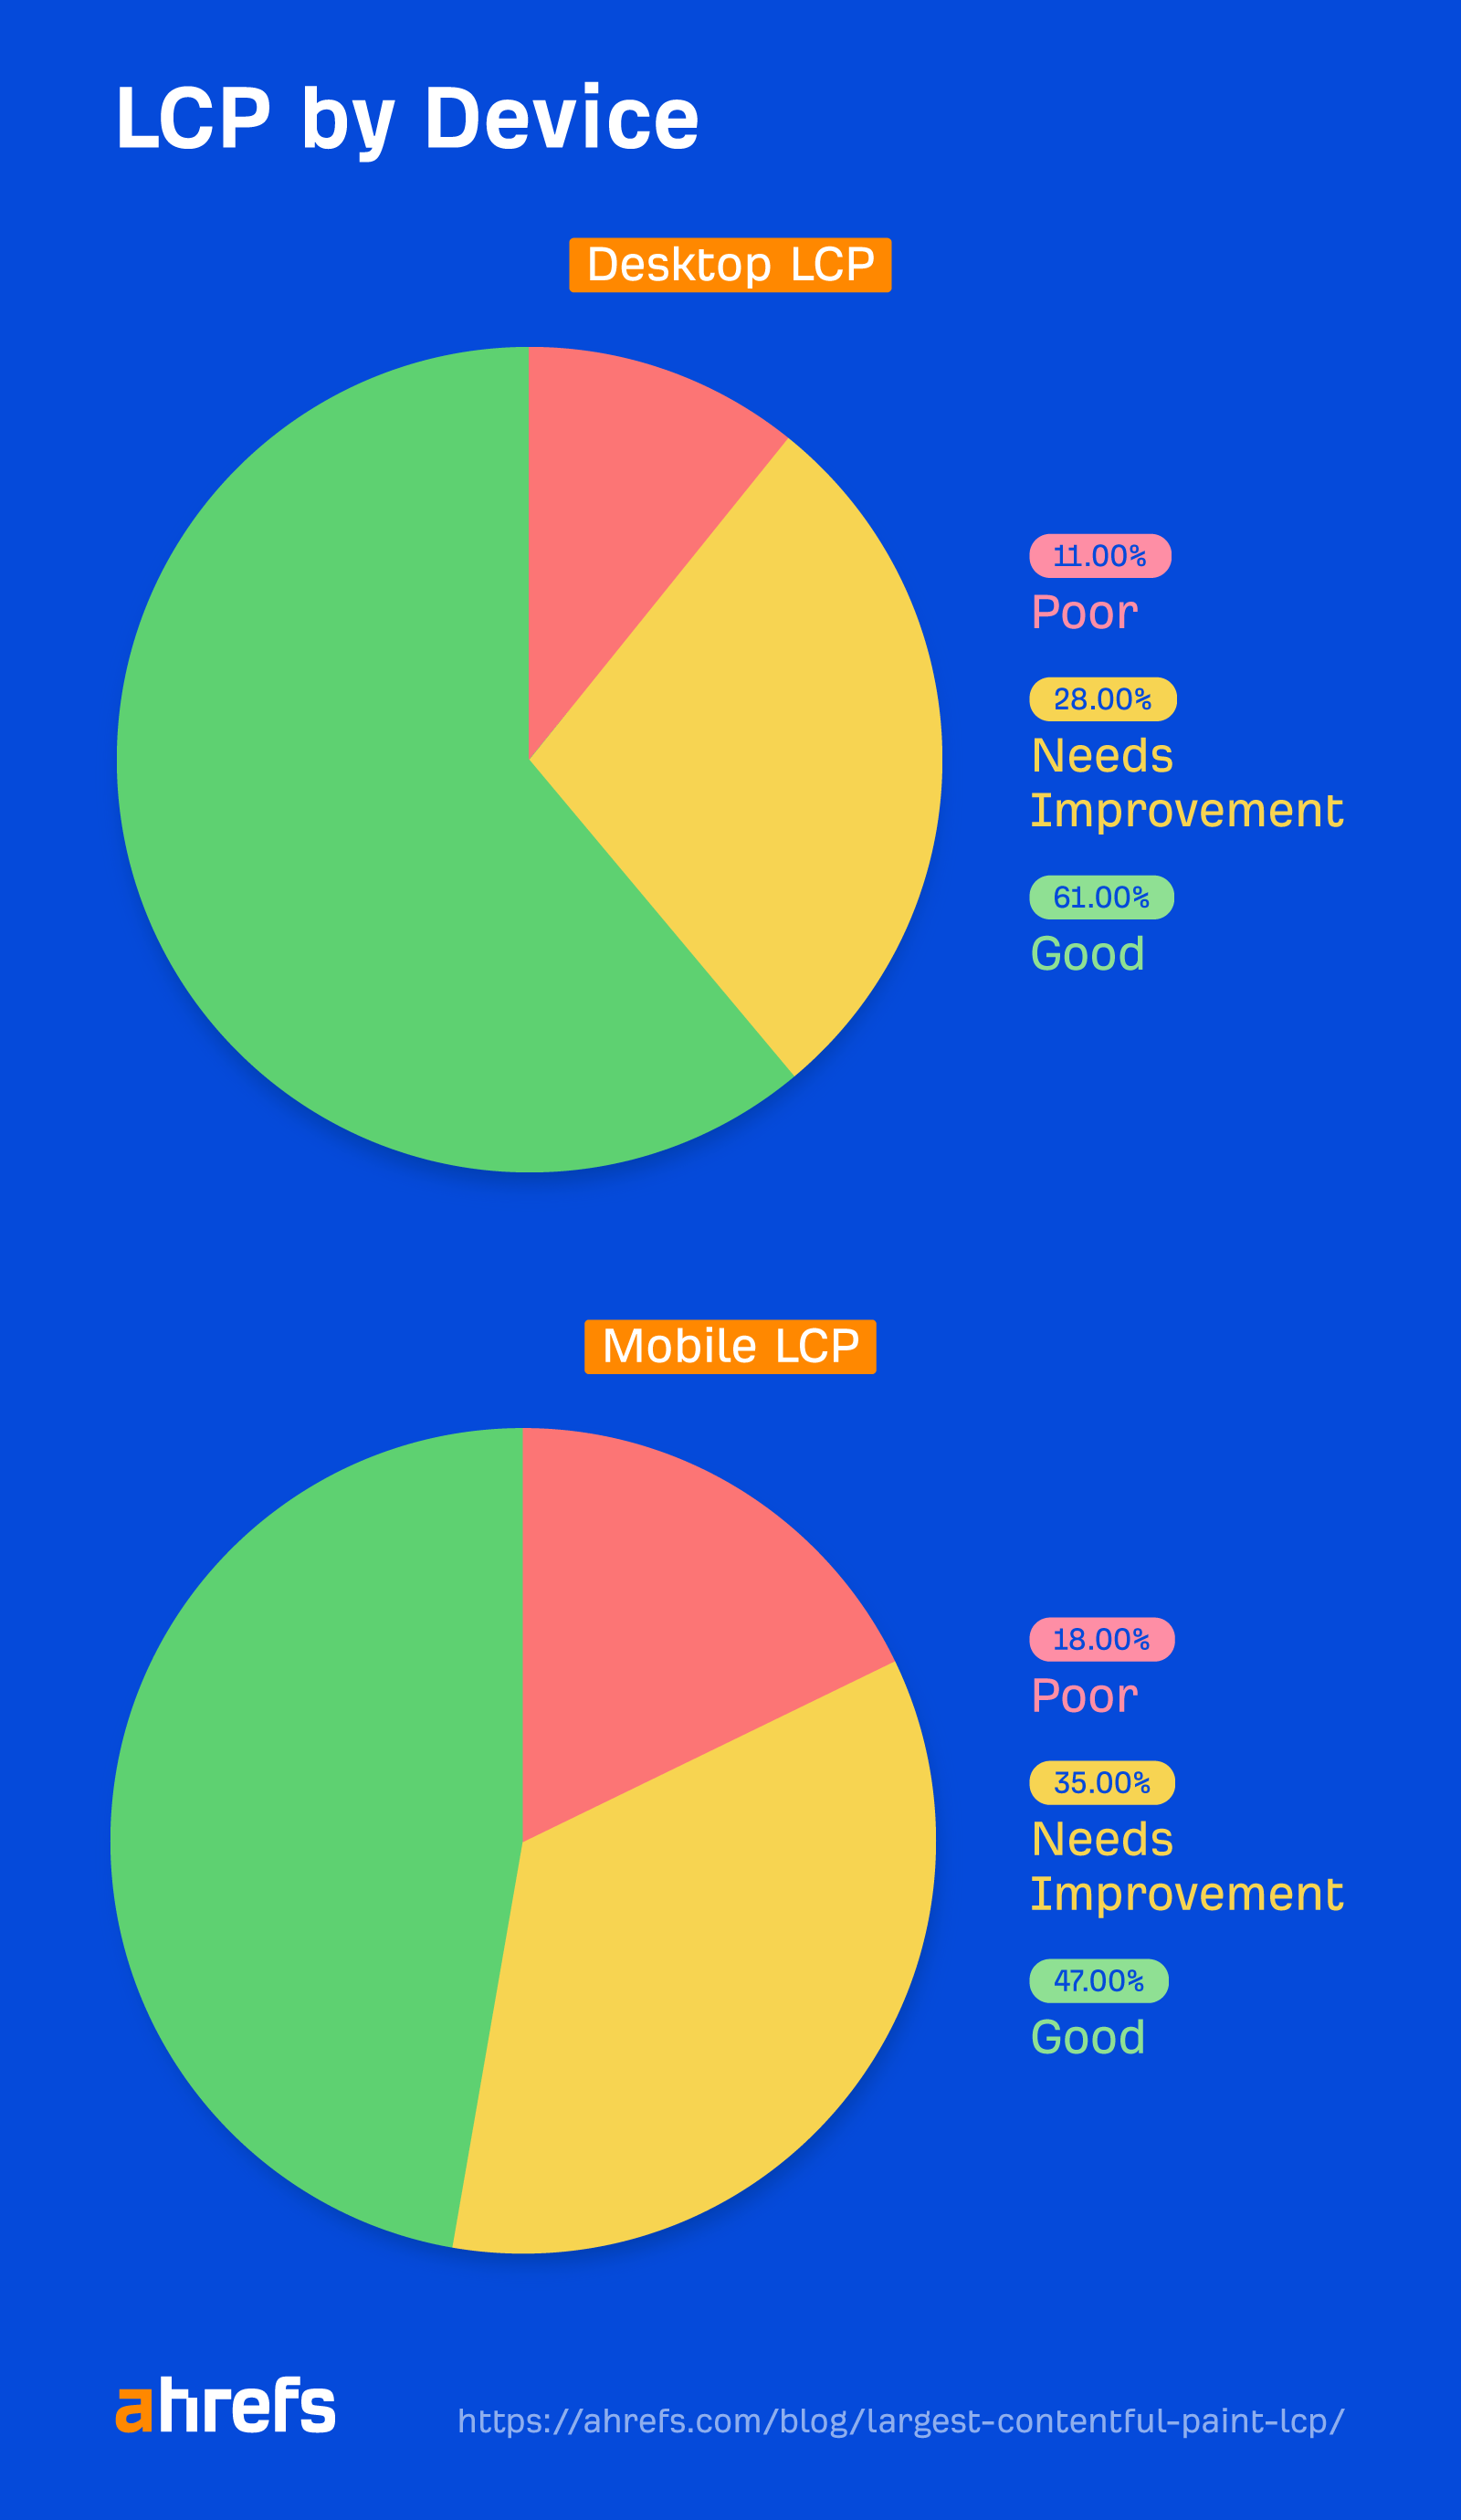
When we ran a study on Core Web Vitals, we saw that pages are less likely to have good LCP values on mobile devices compared to desktop.
The LCP threshold seems almost impossible to pass on slower connections.
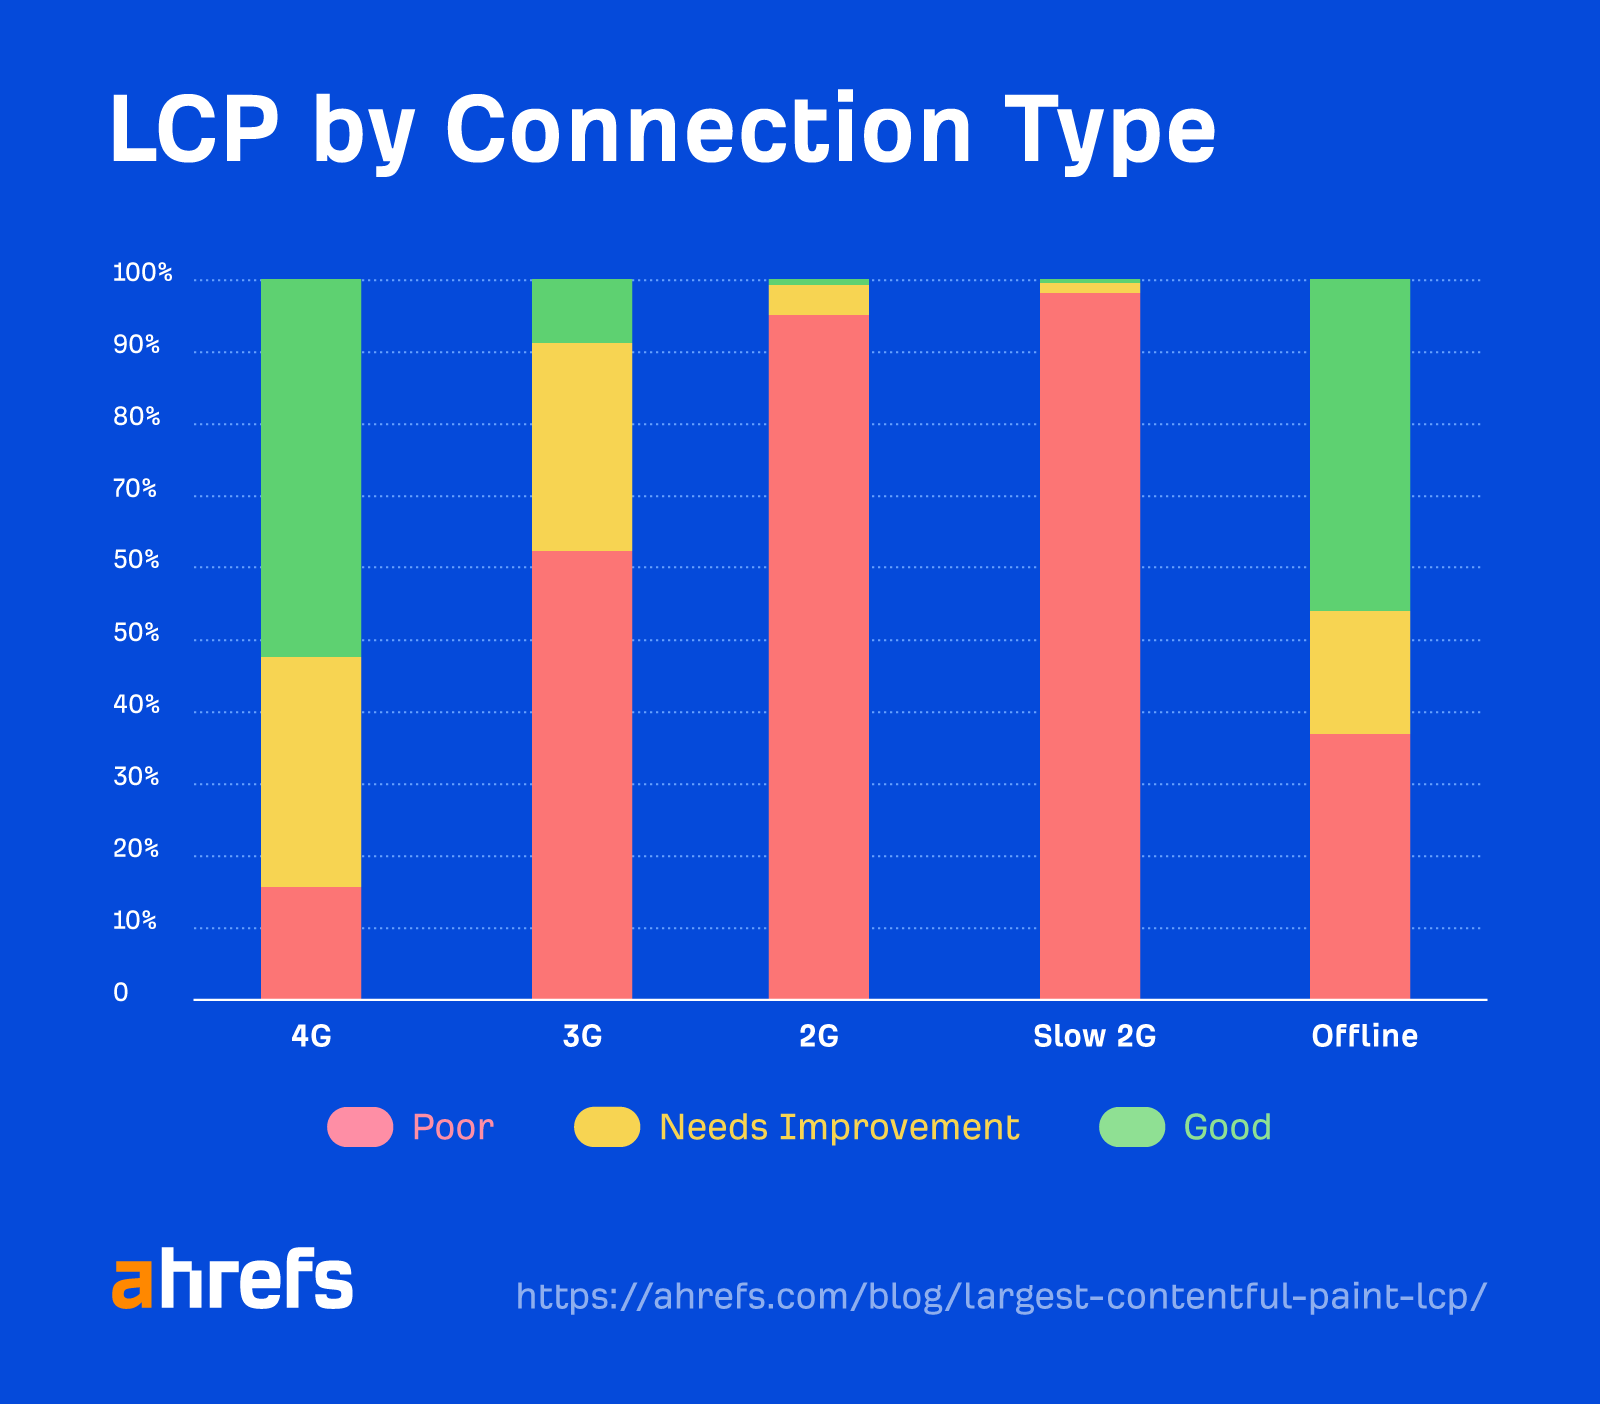
There are a couple of different ways of measuring LCP you’ll want to look at: field data and lab data.
Field data comes from the Chrome User Experience Report (CrUX), which is data from real users of Chrome who choose to share their data. This gives you the best idea of real-world LCP performance across different network conditions, devices, caching, etc. It’s also what you’ll actually be measured on by Google for Core Web Vitals.
Lab data is based on tests with the same conditions to make tests repeatable. Google doesn’t use this for Core Web Vitals, but it’s useful for testing because CrUX/field data is a 28-day rolling average, so it takes a while to see the impact of changes.
The best tool to measure LCP depends on the type of data you want (lab/field) and whether you want it for one URL or many.
Measuring LCP for a single URL
Pagespeed Insights pulls page-level field data that you can’t otherwise query in the CrUX dataset. It also runs lab tests for you based on Google Lighthouse and gives you origin data so you can compare page performance to the entire site.
Measuring LCP for many URLs or an entire site
You can get CrUX data in Google Search Console that is bucketed into the categories of good, needs improvement, and poor.
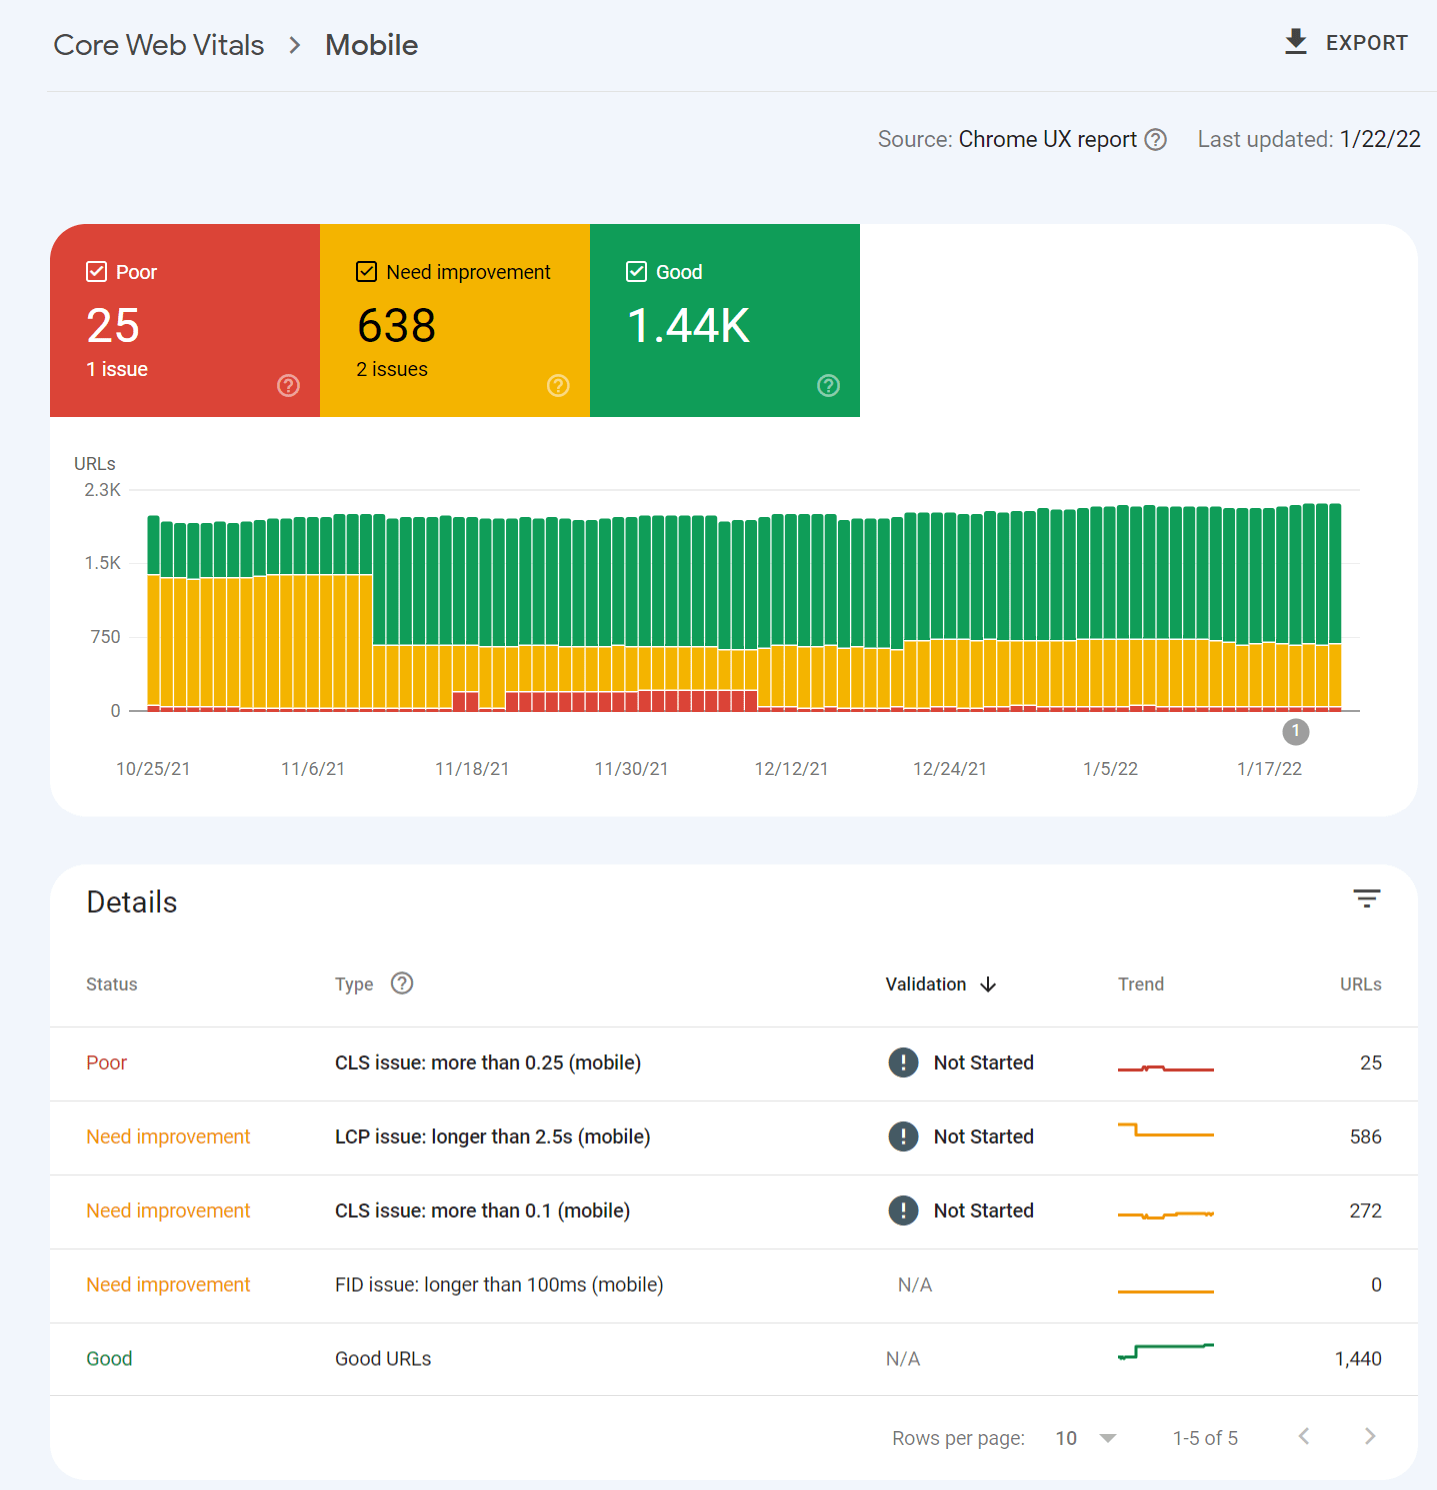
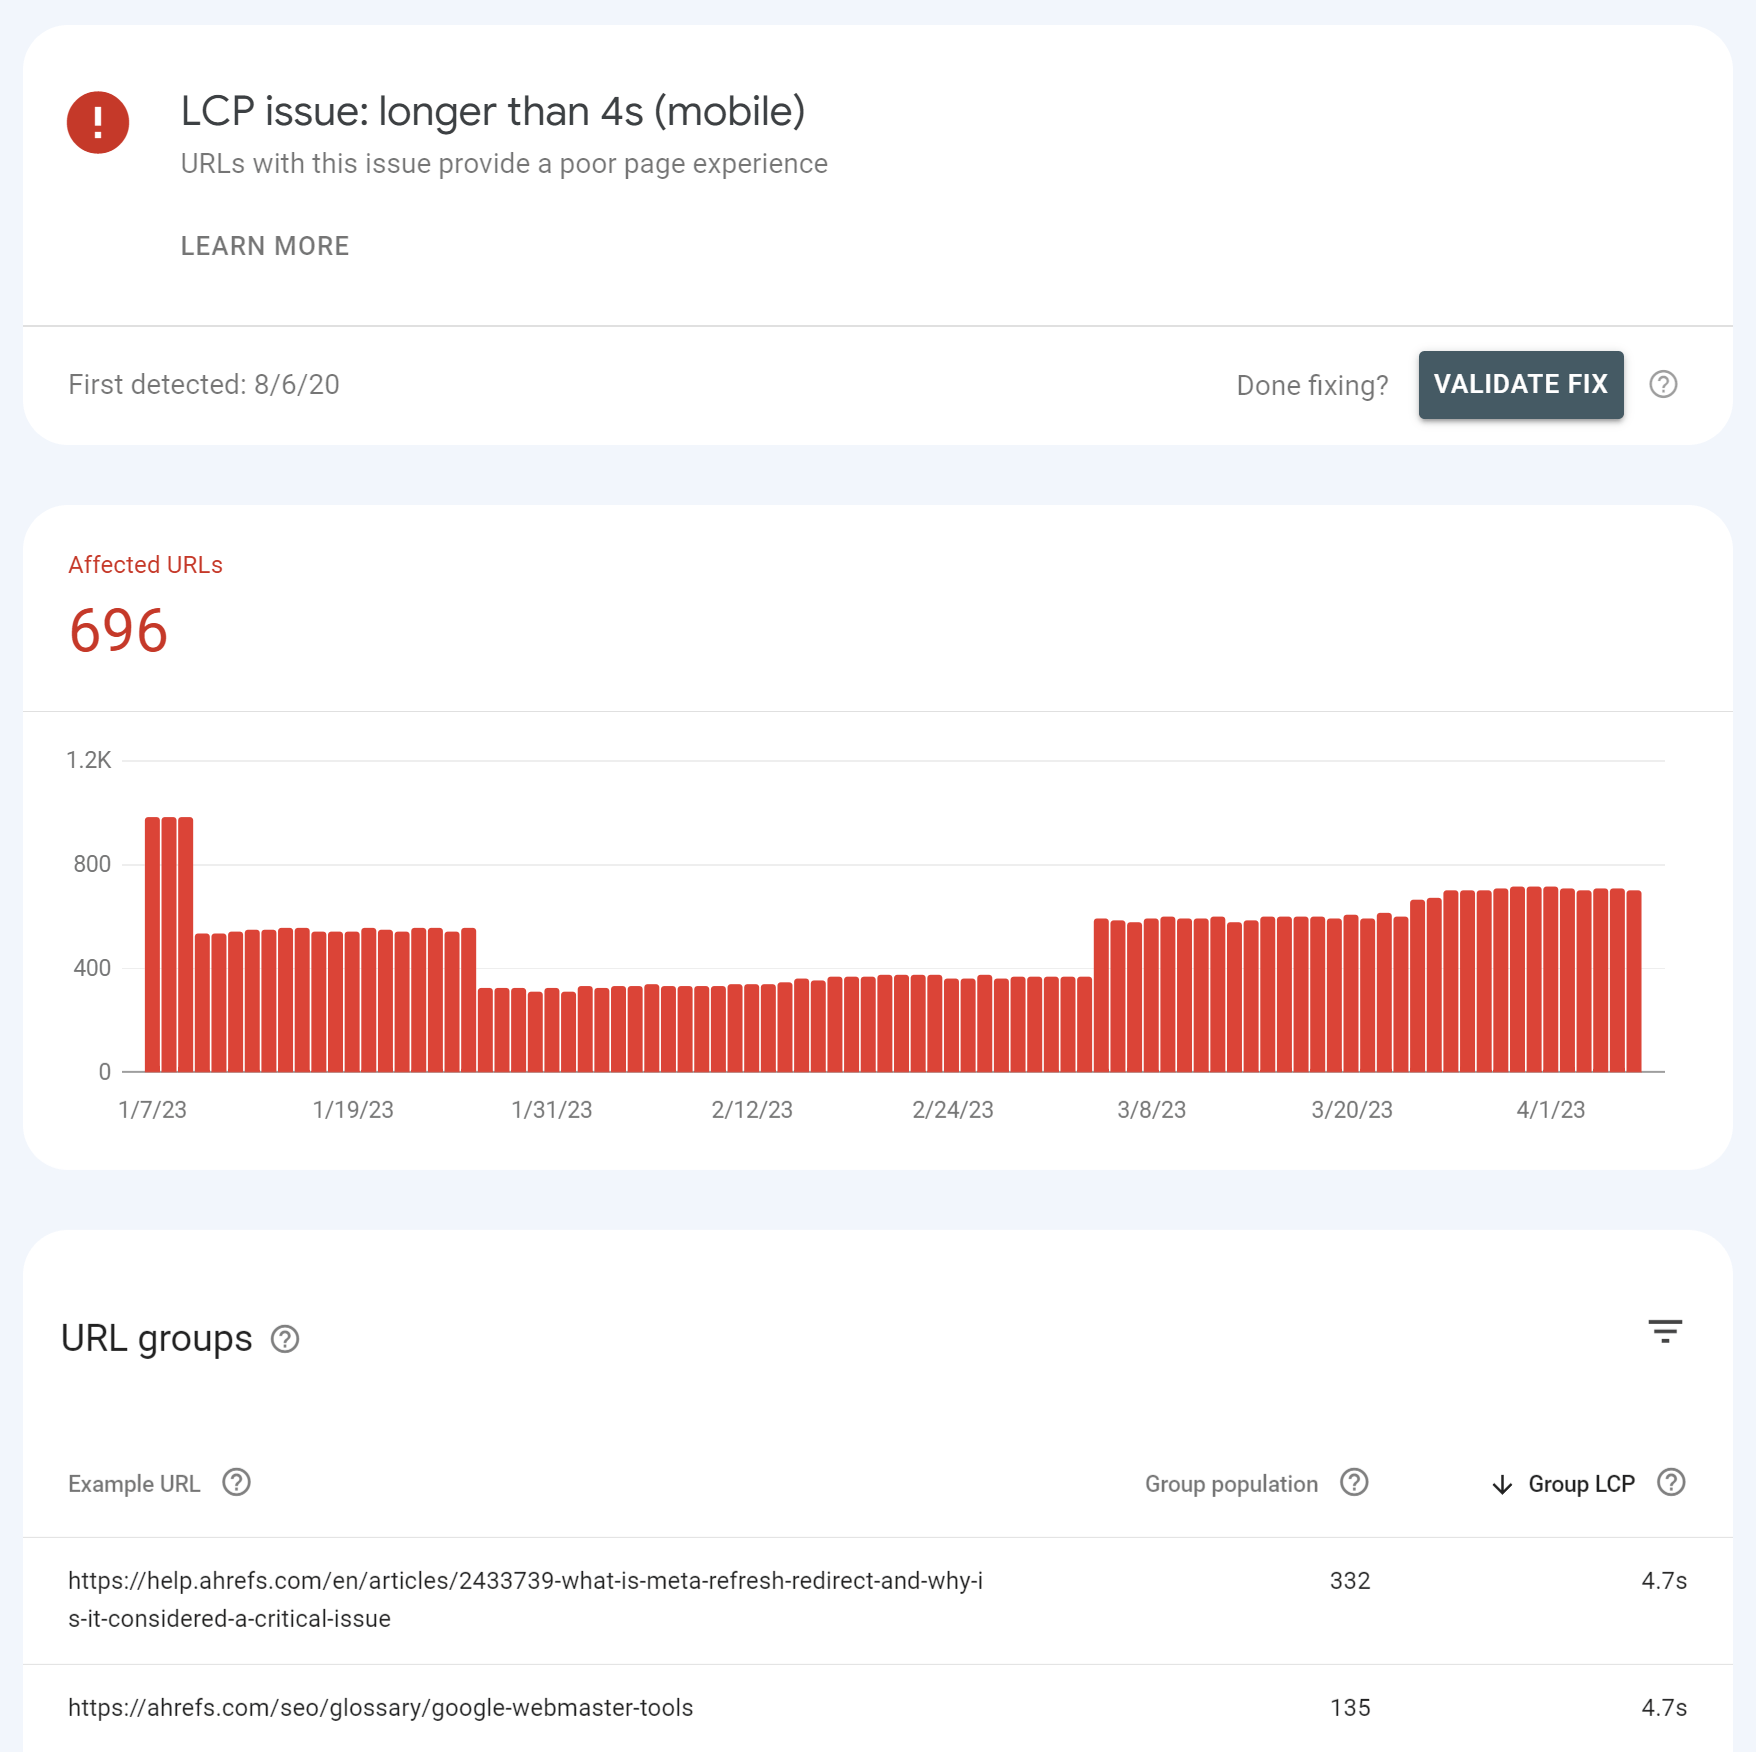
Clicking into one of the issues gives you a breakdown of page groups that are impacted. The groups are pages with similar values that likely use the same template. You make the changes once in the template, and that will be fixed across the pages in the group.
If you want both lab data and field data at scale, the only way to get that is through the PageSpeed Insights API. You can connect to it easily with Ahrefs’ Site Audit and get reports detailing your performance. This is free for verified sites with an Ahrefs Webmaster Tools (AWT) account.
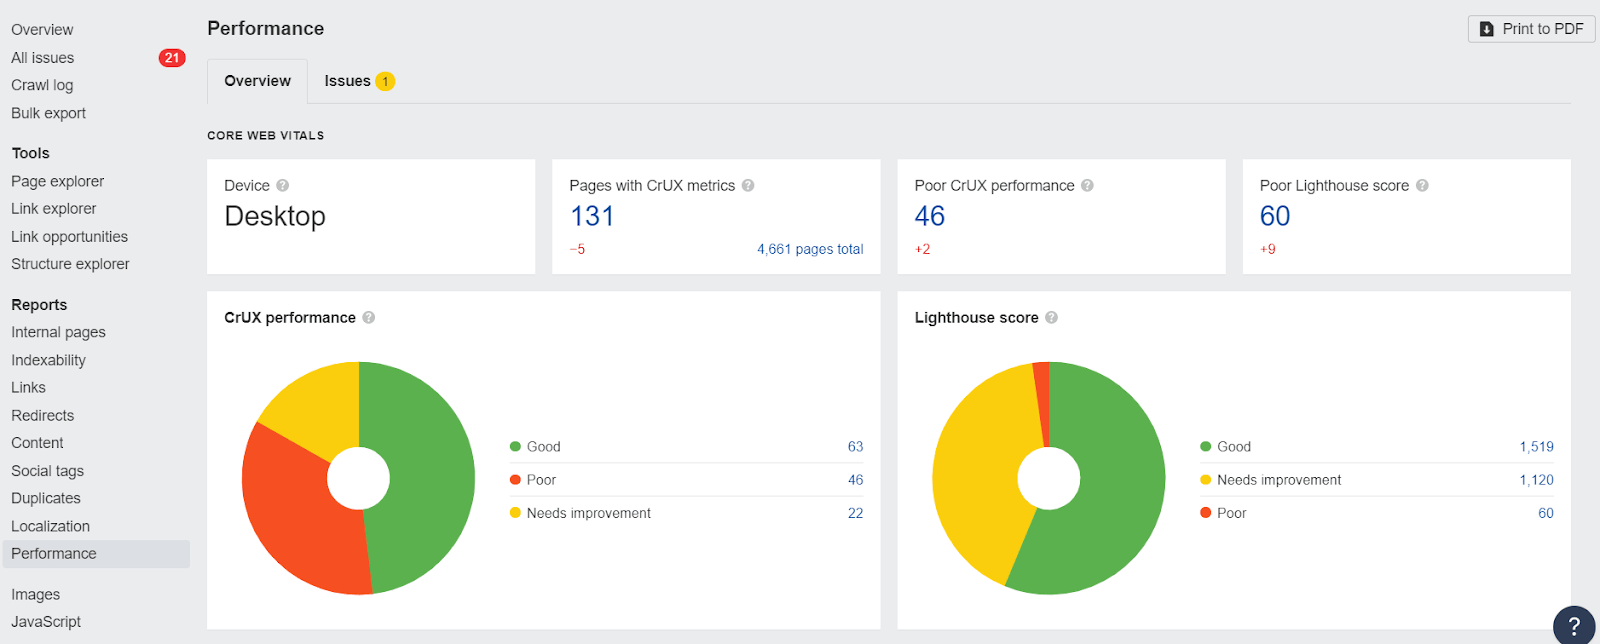
Note that the Core Web Vitals data shown will be determined by the user-agent you select for your crawl during the setup. If you crawl from mobile, you’ll get mobile CWV values from the API.
In PageSpeed Insights, the LCP element will be specified in the “Diagnostics” section. Also, notice there is a tab to select LCP that will only show issues related to LCP. These are the issues seen in the lab test that you’ll want to solve.
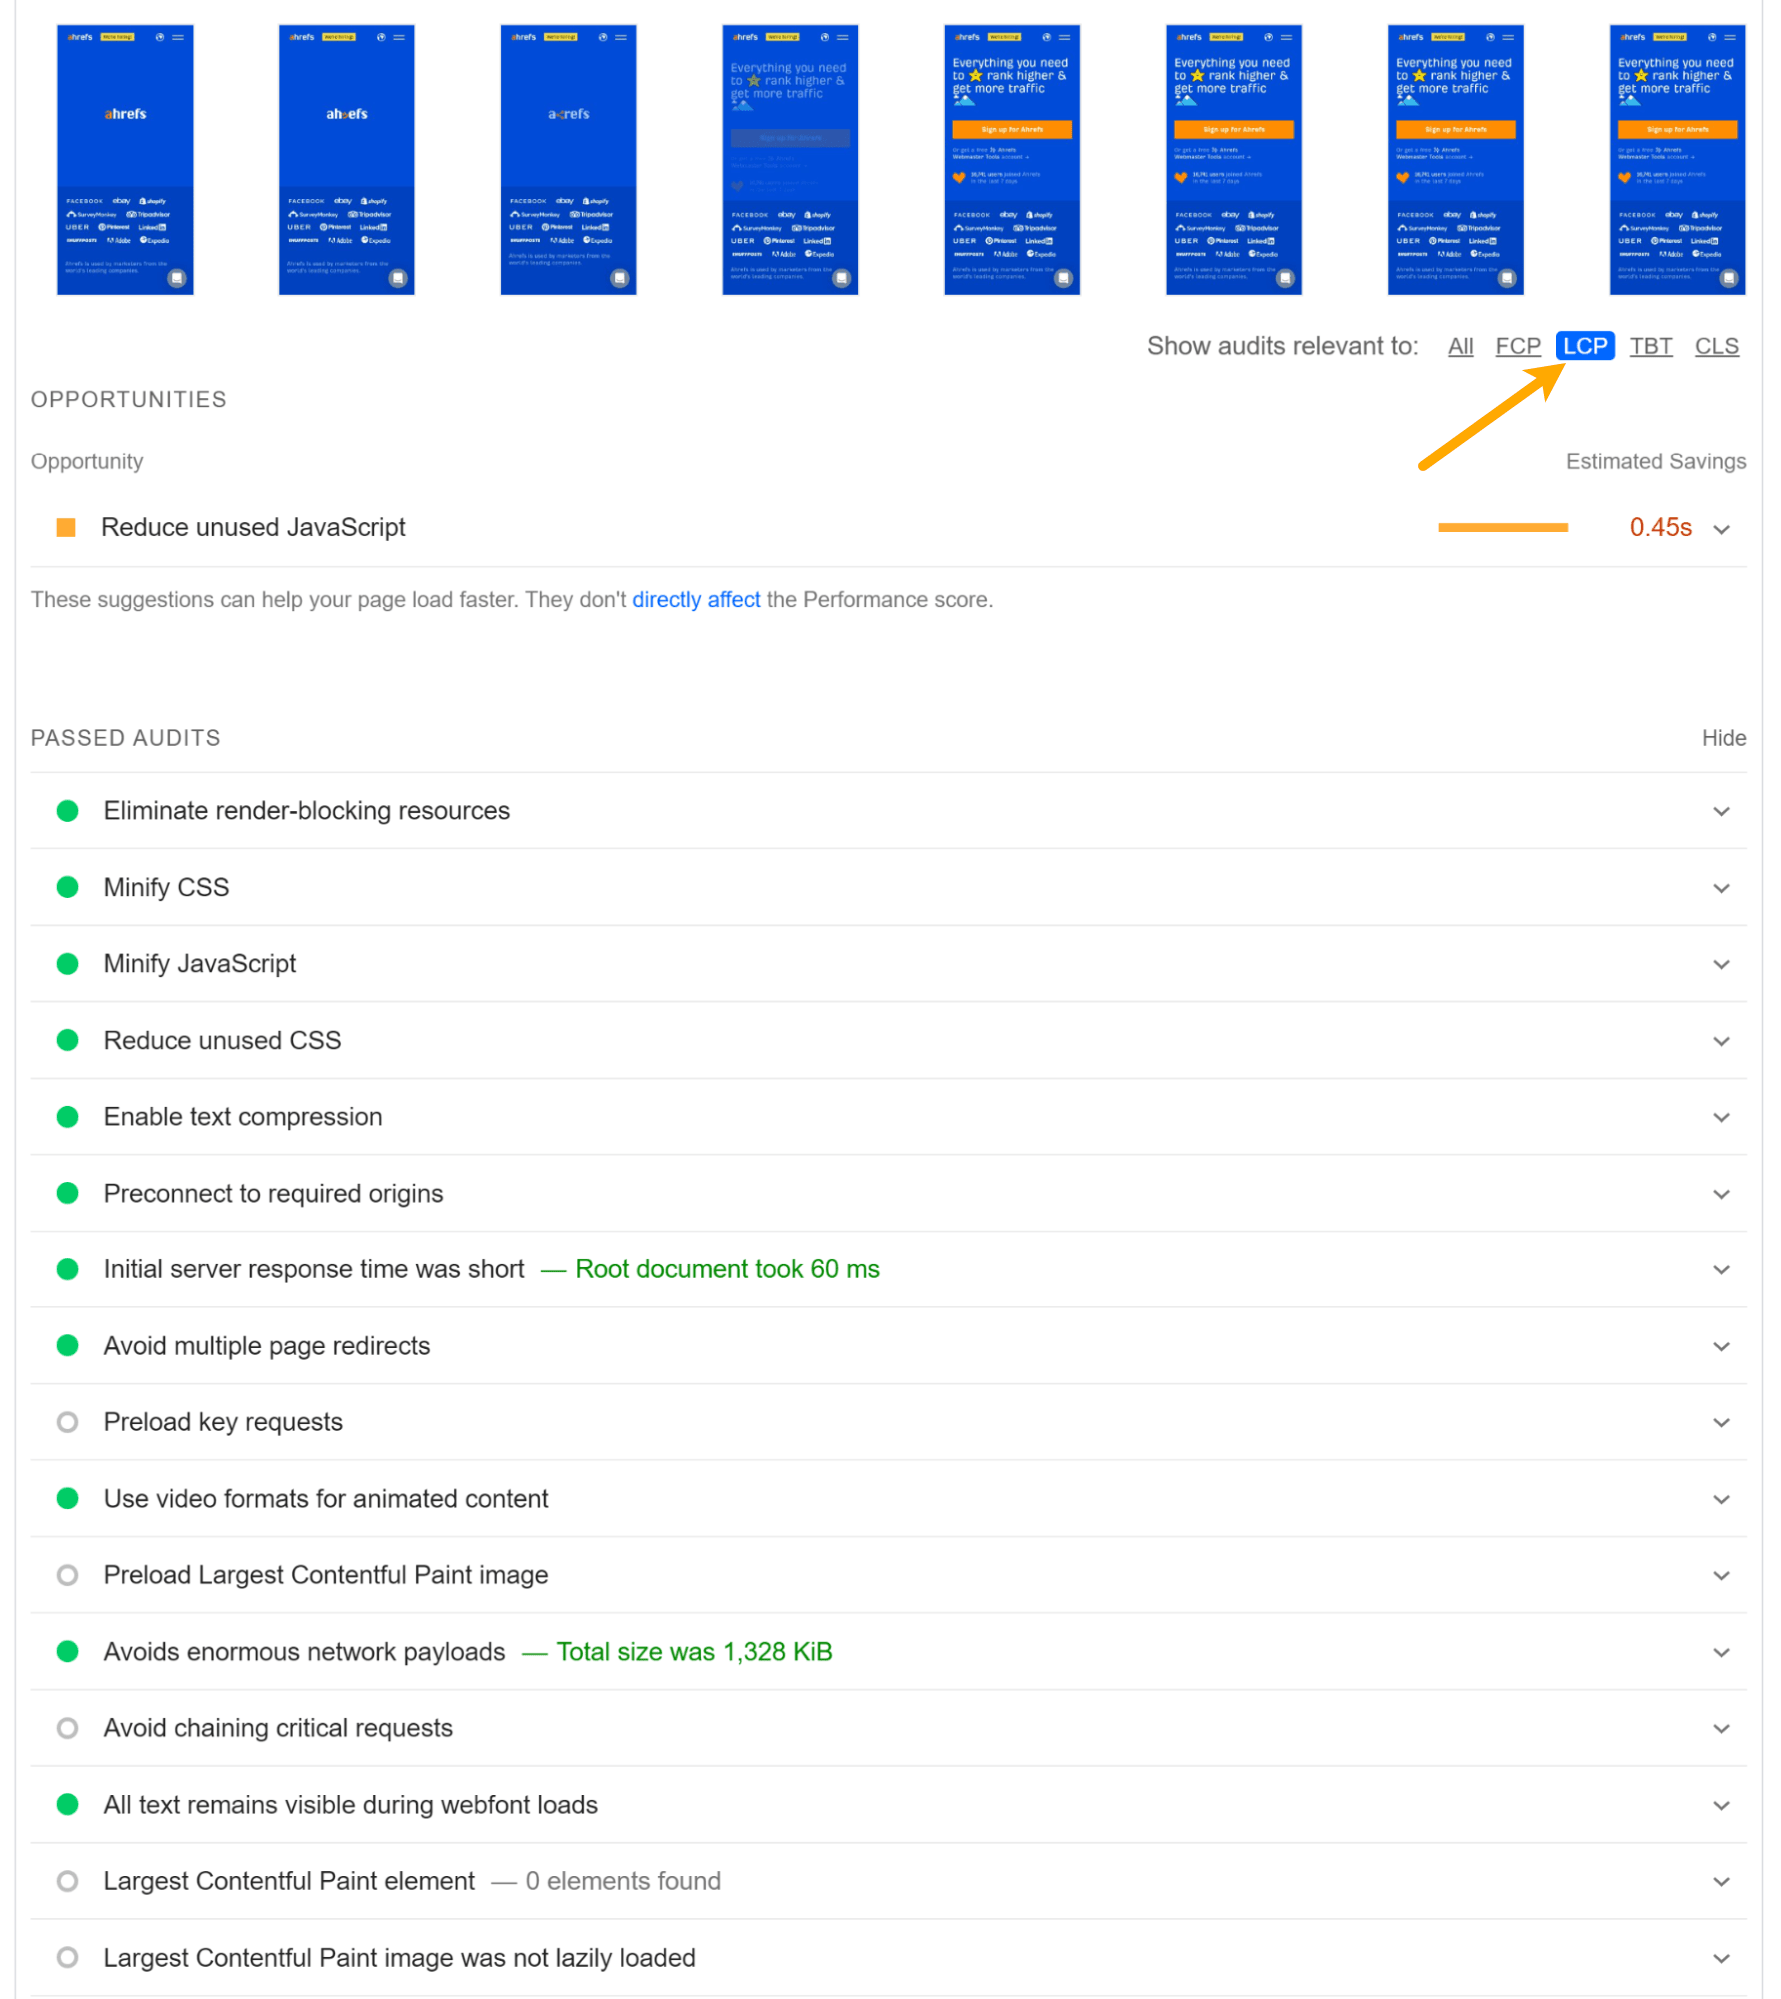
There are a lot of issues that relate to LCP, making it the hardest metric to improve.
The general theory sounds easy enough. Give me the largest element faster. But in practice, this can get fairly complex. Some files may require others to be loaded first, or there may be conflicting priorities in the browser. You may fix a bunch of issues without actually seeing an improvement, which can be frustrating.
If you’re not very technical and don’t want to hire someone, look for performance or page speed optimization plugins, modules, or packages for whatever system you’re using. You can use the below information as a guide for what features you may need.
Here are a few ways you can improve LCP:
1. Find your LCP element
In PageSpeed Insights, you can click “Largest Contentful Paint element” in the “Diagnostics” section, and it will identify your LCP element.

2. Prioritize loading of resources
To pass the LCP check, you should prioritize how your resources are loaded in the critical rendering path. What I mean by that is you want to rearrange the order in which the resources are downloaded and processed.
You should first load the resources needed for your LCP element and any other resources needed for the content above the fold. After the initially visible elements are loaded for users, the rest are then loaded.
Many sites can get to a passing time for LCP by just adding some early hints or preload statements for things like the main image, as well as necessary stylesheets and fonts. Let’s look at how to optimize the various resource types.
Images early
If you don’t need the image, the most impactful solution is to simply get rid of it. If you must have the image, I suggest optimizing the size and quality to keep it as small as possible.
You can also use Early Hints. Fetchpriority=”high” can be used on <img> or <link> tags and tells browsers to get the image early. This means it’s going to display a little earlier.
Early Hints don’t work on all browsers, so you may also want to preload the image. This is going to start the download of that image a little earlier, but not quite as early as fetchpriority=”high”.
A preload statement for a responsive image looks like this:
<link rel="preload" as="image" href=“cat.jpg"
imagesrcset=“cat_400px.jpg 400w,
cat_800px.jpg 800w, cat_1600px.jpg 1600w"
imagesizes="50vw">
You can even use fetchpriority=”high” and preload together!
Images late
You should lazy load any images that you don’t need immediately. This loads images later in the process or when a user is close to seeing them. You can use loading=“lazy” like this:
<img src=“cat.jpg" alt=“cat" loading="lazy">
Do not lazy load images above the fold!
CSS early
We already talked about removing unused CSS and minifying the CSS you have.
The other major thing you should do is to inline critical CSS. What this does is it takes the part of the CSS needed to load the content users see immediately and then applies it directly into the HTML. When the HTML is downloaded, all the CSS needed to load what users see is already available.
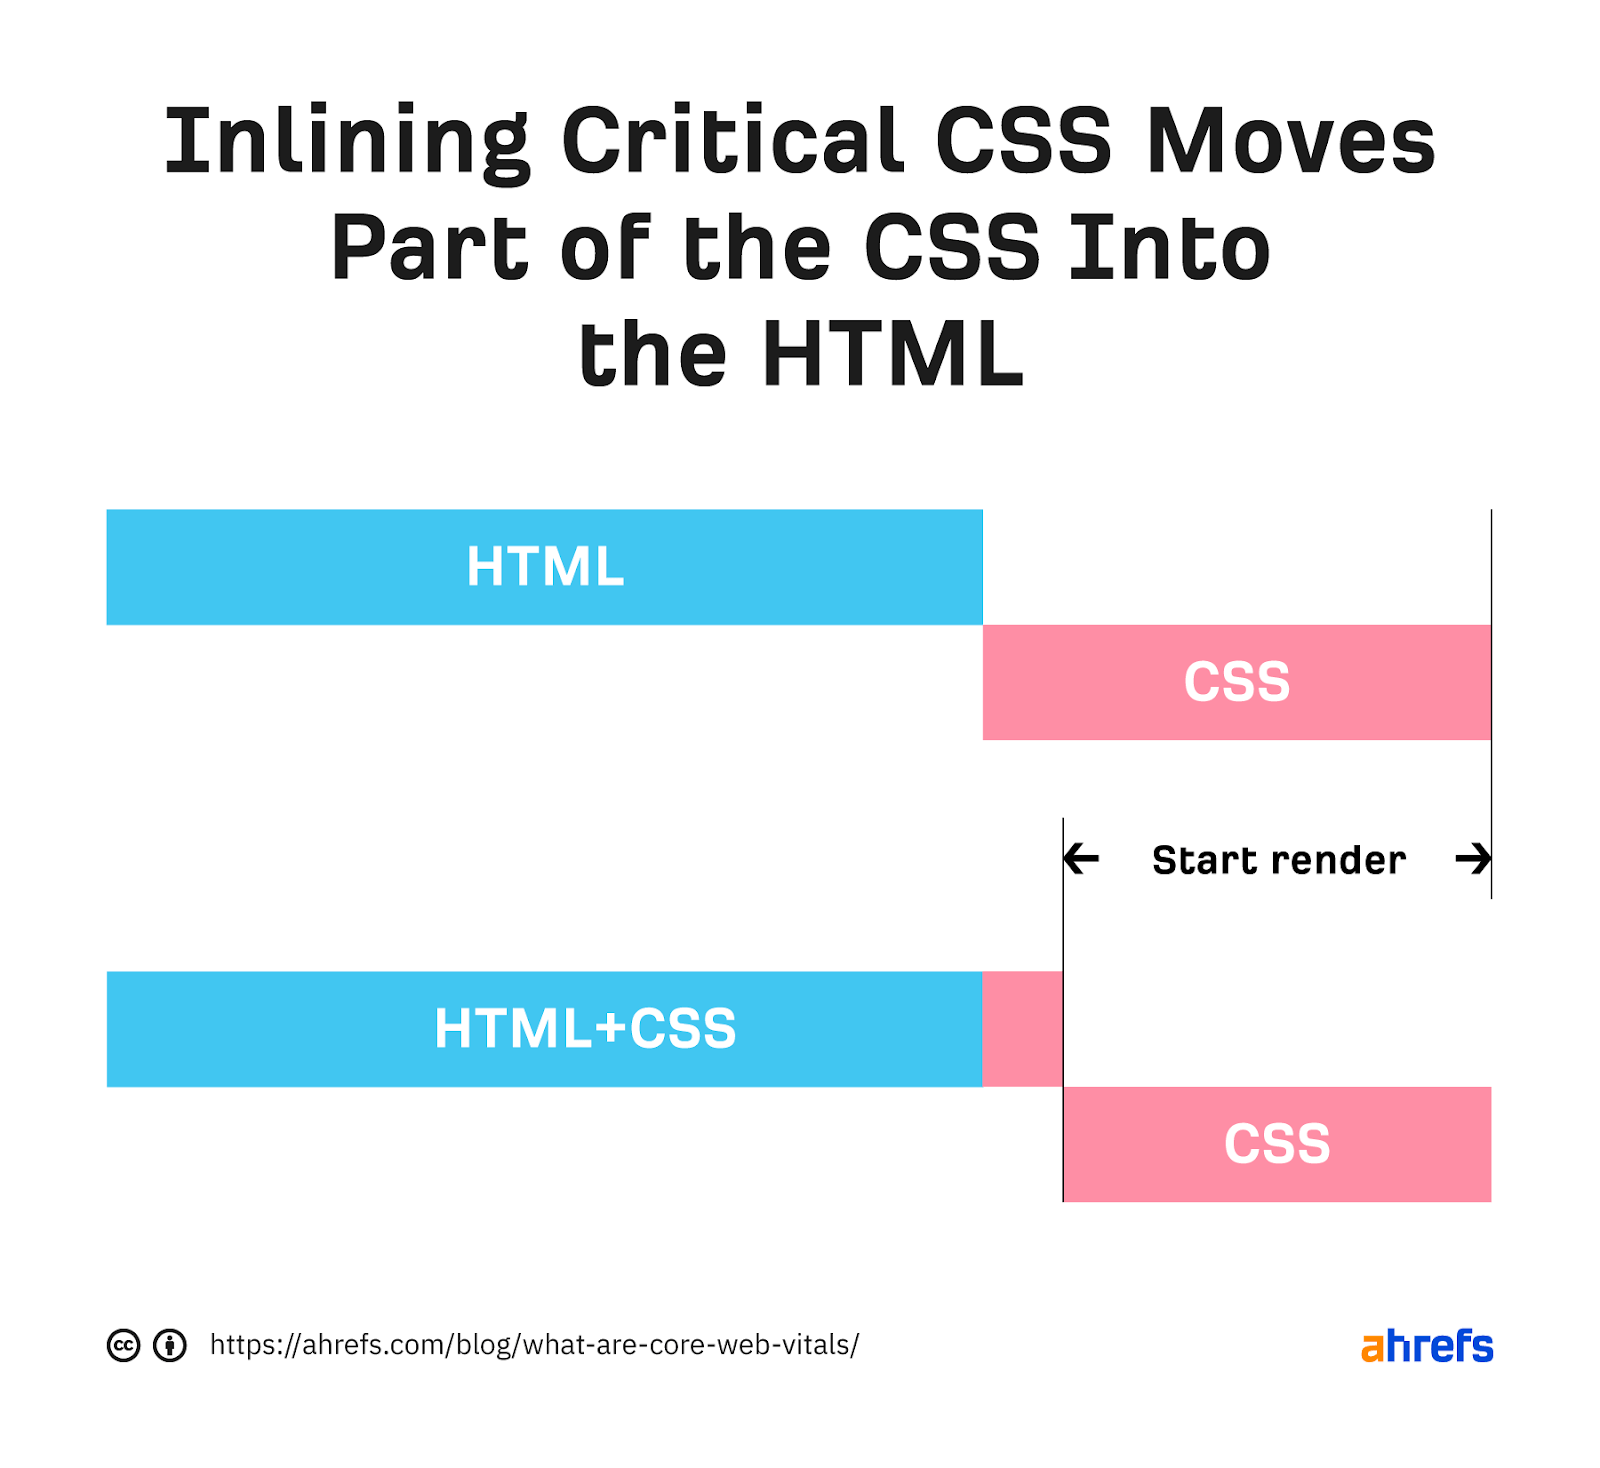
CSS late
With any extra CSS that isn’t critical, you’ll want to apply it later in the process. You can go ahead and start downloading the CSS with a preload statement but not apply the CSS until later with an onload event. This looks like:
<link rel="preload" href="https://ahrefs.com/blog/largest-contentful-paint-lcp/stylesheet.css" as="style" onload="this.rel="stylesheet"">
Fonts
I’m going to give you a few options here:
Good: Preload your fonts. Even better if you use the same server to get rid of the connection.
Better: Font-display: optional. This can be paired with a preload statement. This is going to give your font a small window of time to load. If the font doesn’t make it in time, the initial page load will simply show a default font. Your custom font will then be cached and show up on subsequent page loads.
Best: Just use a system font. There’s nothing to load—so no delays.
JavaScript early
We already talked about removing unused JavaScript and minifying what you have. If you’re using a JavaScript framework, then you may want to prerender or server-side render (SSR) the page.
You can also inline the JavaScript needed early. This works the same way as was described in the CSS section, where you move portions from your JavaScript files to instead be loaded with the HTML.
Another option is to preload the JavaScript files so that you get them earlier. This should only be done for assets needed to load the content above the fold or if some functionality depends on this JavaScript.
JavaScript late
Any JavaScript you don’t need immediately should be loaded later. There are two main ways to do that—defer and async attributes. These attributes can be added to your script tags.
Usually, a script being downloaded blocks the parser while downloading and executing. Async will let the parsing and downloading occur at the same time but still block parsing during the script execution. Defer will not block parsing during the download and only execute after the HTML has finished parsing.
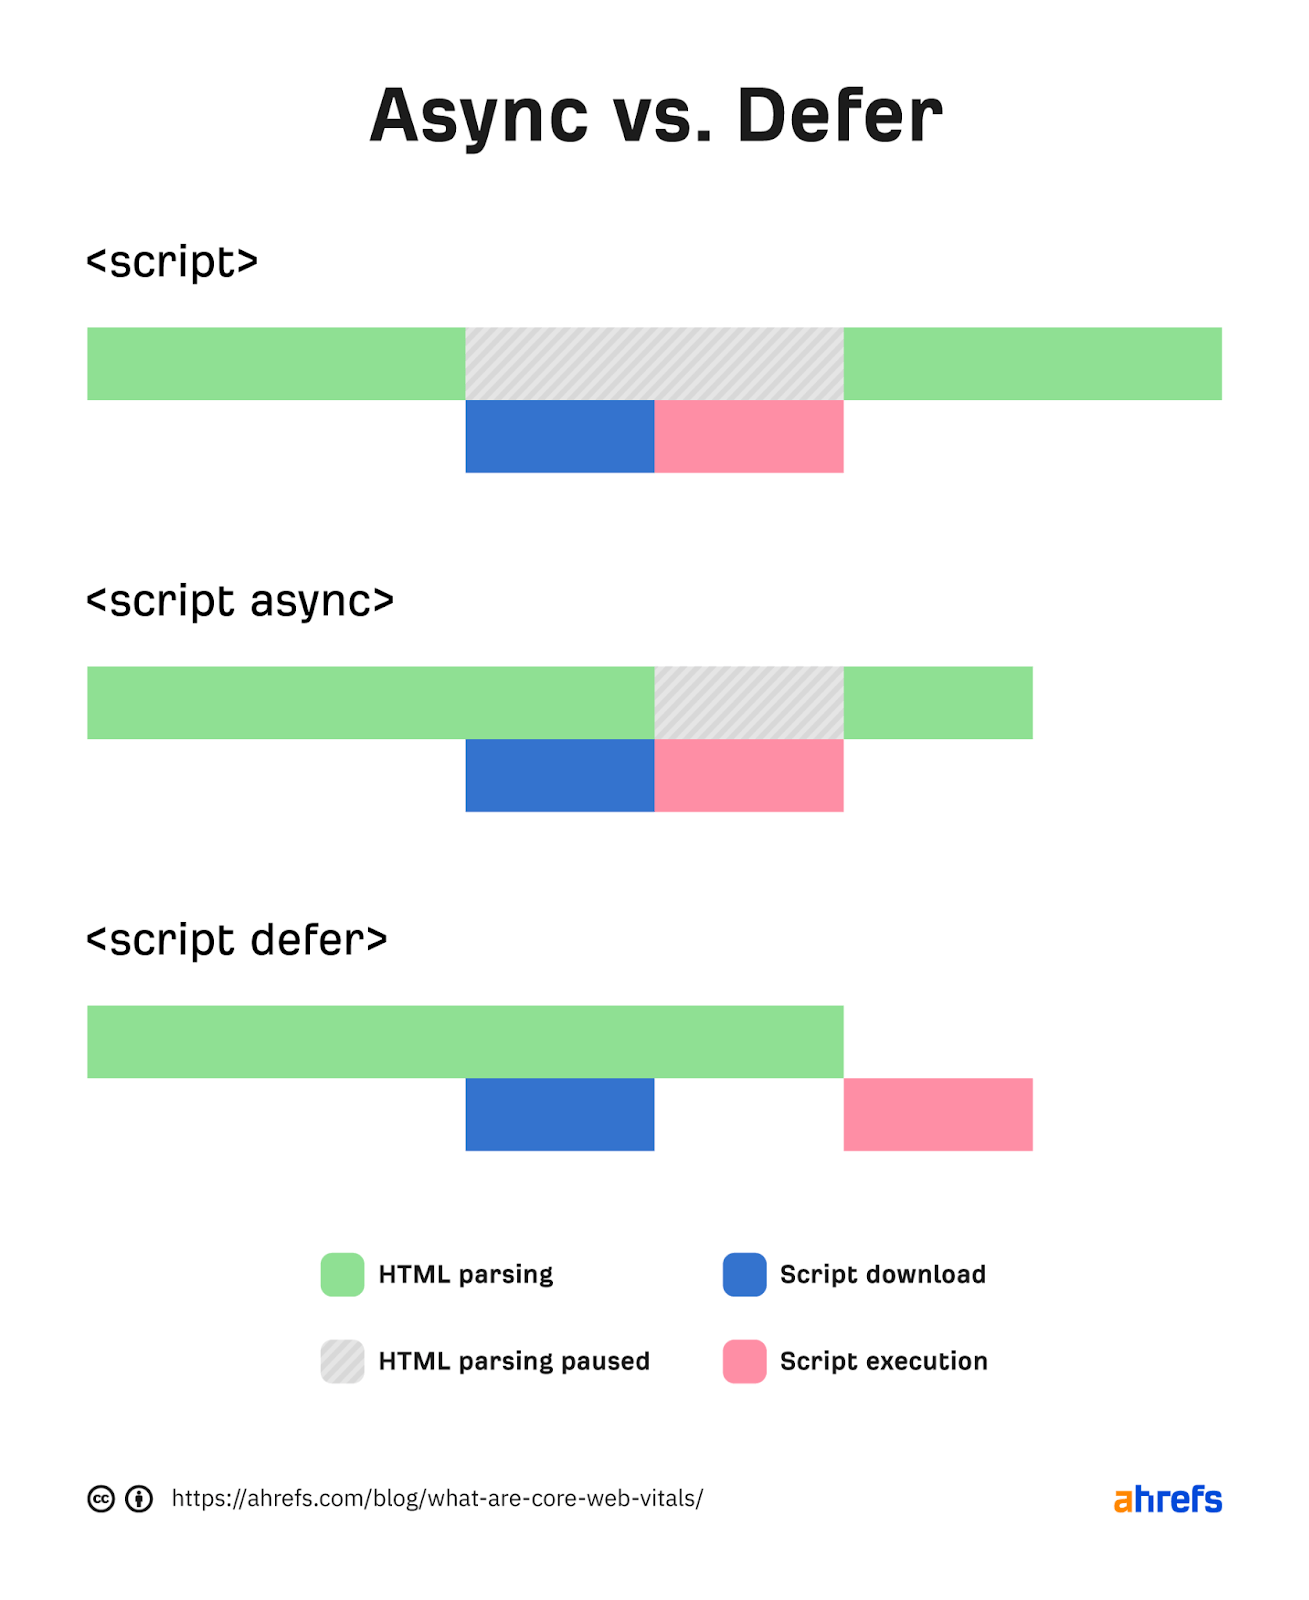
Which should you use? For anything that you want earlier or that has dependencies, I’d lean toward async.
For instance, I tend to use async on analytics tags so that more users are recorded. You’ll want to defer anything that is not needed until later or doesn’t have dependencies. The attributes are pretty easy to add.
Check out these examples:
Normal:
<script src="https://www.domain.com/file.js"></script>
Async:
<script src="https://www.domain.com/file.js" async></script>
Defer:
<script src="https://www.domain.com/file.js" defer></script>
3. Make files smaller
If you can get rid of any files or reduce their sizes, then your page will load faster. This means you may want to delete any files not being used or parts of the code that aren’t used.
How you go about this will depend a lot on your setup, but the process for removing unneeded parts of files is usually referred to as tree shaking.
This is commonly done via an automated process with Webpack or Grunt with JavaScript frameworks or sometimes even systems like WordPress, but most common CMS systems may not support this.
You may want to skip this or see if there are any plugins that have this option for your system.
To make the files smaller, you typically want to compress them.
Pretty much every file type used to build your website can be compressed, including CSS, JavaScript, Images, and HTML. Also, nearly every system and server support compression.
It’s usually done at the server or CDN level, but some plugins support this like WP Rocket for WordPress.
4. Serve files closer to users
Information takes time to travel. The further you are from a server, the longer it takes for the data to be transferred. Unless you serve a small geographical area, having a Content Delivery Network (CDN) is a good idea.
CDNs give you a way to connect and serve your site that’s closer to users. It’s like having copies of your server in different locations around the world.
5. Host resources on the same server
When you first connect to a server, there’s a process that navigates the web and establishes a secure connection between you and the server.
This takes some time, and each new connection you need to make adds additional delay while it goes through the same process. If you host your resources on the same server, you can eliminate those extra delays.
If you can’t use the same server, you may want to use preconnect or DNS-prefetch to start connections earlier. A browser will typically wait for the HTML to finish downloading before starting a connection. But with preconnect or DNS-prefetch, it starts earlier than it normally would. Do note that DNS-prefetch has better support than preconnect.
For each resource you want to get early, you add a new statement like:
<link rel="preconnect" href="https://fonts.googleapis.com/">
<link rel="dns-prefetch" href="https://fonts.googleapis.com/" />
6. Use caching
When you cache resources, they’re downloaded for the first page view but don’t need to be downloaded for subsequent page views. With the resources already available, additional page loads will be much faster.
Check out how few files are downloaded in the second page load in the waterfall charts below.
First load of the page:
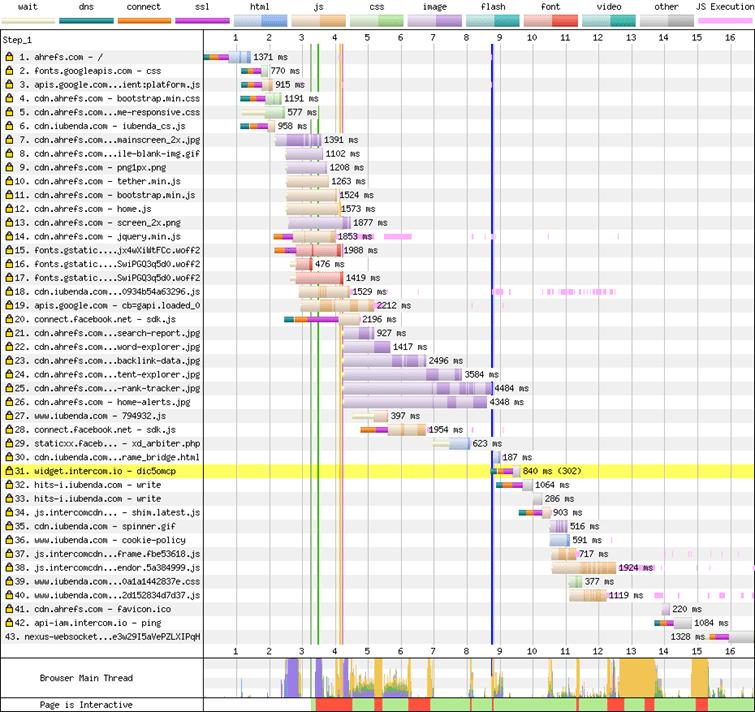
Second load of the page:

If you can, cache on a CDN as well. Your cache time should be as long as you are comfortable with.
An ideal setup is to cache for a really long period of time but purge the cache when you make a change to a page.
7. Misc
There are a few other technologies that you may want to look at to help with performance. These include Speculative Prerendering, Signed Exchanges, and HTTP/3.
Final thoughts
Is there a better metric to measure visible load? I don’t see anything new on the horizon at this time. We’ve already seen several evolutions trying to measure the load.
Load and DOMContentLoaded don’t really tell you what a user sees. First Contentful Paint (FCP) is the beginning of the loading experience. First Meaning Paint (FMP) and Speed Index (SI) are complex and don’t really identify when the main content has been loaded.
If you have any questions, message me on Twitter.


![How to Optimize for Google’s Featured Snippets [Updated for 2024]](https://moz.com/images/blog/Blog-OG-images/How-to-Optimize-for-Googles-Featured-Snippets-OG-Image.png?w=1200&h=630&q=82&auto=format&fit=crop&dm=1724004002&s=13df73104762982790dab6dc8328023f)

